

 |
||
|
|
||
|
|
||
|
|
||
|
|
||
|
|
||
 |
My name is bob.The NetRadar User Interface
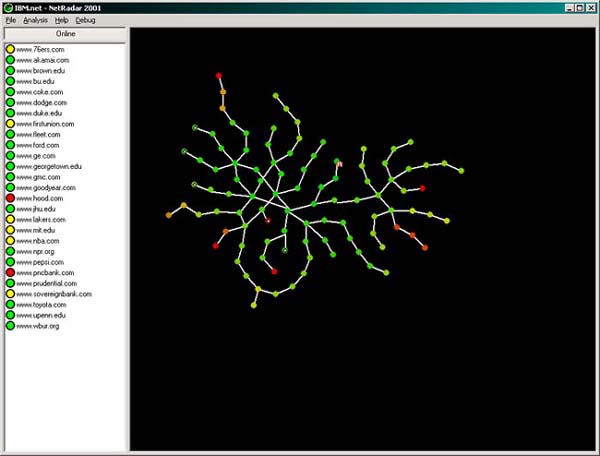
Lets set up some basic concepts for NetRadar:How NetRadar WorksSo, what does NetRadar have as its parts? Lets see a picture of NetRadar:
- The graph it produces is called a RouteTree
- NetRadar is like an experimental apparatus: you have to give it data for it to produce results
On the right of the screen is the "graph window" which contains the RouteTree graph that looks so cool. The left window contains the data and controls you need to produce the graph. There are a few menu options as well, ranging from debugging commands that do nothing for you (they're there for developers) to commands for simplifying the graph for you. Don't forget your right mouse button... use it on the left and right for different useful options that aren't available anywhere else. In order for NetRadar to work, you've got to give it some data to work with. These data represent some web sites whose performance you would be concerned with... they are callled Targets, and are aptly enough, stored in the target list, the window on the left. if you're an important person and are concerned with the entire Interent, then enter a whole huge selection of computers and sites that occur to you. If you're interested in your connection to a particular area of the Internet, say, your connection to the UK from the USA, then enter a ton of .uk web sites. To create a target, right click in the left window, select "New Target" and fill in the window that appears. Enter your target as a domain name or IP address... do not enter things like HTTP:// or anything! Shortly after you press OK, NetRadar will test this target, and begin creating a graph on the right window. Add 15-20 targets for best results What does the graph mean? The graph on the right represents your network connection to the Internet. Look carefully at your graph and find the dot with a small red R next to it... this represents your primary gateway, the computer you use to access the Internet. Each of the other dots represent other routers on the network that you use to access different parts of the Internet. If you move your mouse over a dot, a window will appear showing you the name of the router for curiosity's sake. A link between dots represents a connection between the routers. The length of the link is irrelevant - it adjusts simply to make the graph readable.
Colors: The graph is colored to represent performance, and is the real reason that this program is useful. Red areas represent congestion, while green areas represent fast parts of the network. When you are looking for congestion, look specifically at the area where the color shifts rapidly from green to red - which directly indicates the cause of the congestion. The colors are based on a normal distribution of performance data. Additional Options: NetRadar has a bunch of wierd options that you can experiment with in the menu system... defintely, though, take advantage of AutoTrim under the analysis menu, which will remove the long chains on your graph for readability. If you want to explore these hidden areas, double click the plus sign on the end of the graph, which will cause the chain to expand. If this doesn't work, right click the node and hit expand. Other options that you might want to take advantage of are things like locking nodes, which can help you to organize the graph as you want to - while dragging a node, hold down shift, and release the node. Repeat this same procedure to unlock a node.
NetRadar is a software implementation of what is called RouteTree Theory. RouteTree theory allows us to use traceroute data combined with ping, roundtrip, or unidirectional download measurements to locate the sources of congestion on a network. RouteTree theory is outlined in full at the above website. In general, NetRadar implements three aspects of RouteTree theory:FirewallsBy far, the most interesting part of this program is the visualizations it produces, which are pretty cool looking. However, how are they produced?
- Data gathering
- RouteTree Analysis
- Visualization
Data Gathering: In order to map your internet connection, NetRadar needs "data sources" or targets, which you input. These targets enter a waiting queue that gets tested every few minutes (the time frequency can be adjusted by right clicking on a target in the left window and selecting properties). When a target is tested, NetRadar bursts out a number of UDP packets to the target. Each packet has a different TTL field entry (time to live) ranging from 1 upward... this causes the packets to die while in route to their final destination. When a packet dies, it produces an error message, in the form of a ICMP packet, which is sent back to the originating host. We recieve these error packets and can learn two things from them, first, how long it took to get the error message, and second, where the error message came from. This gives us an idea of round trip time to that part of the network, plus the route used to get to the target being tested. We do this for every target, and record the data for RouteTree analysis. RouteTree Analysis: While I won't go into detail about this stage, RouteTree analysis takes the data from the previous stage and analyzes it for consistency. The trick in the data from the previous section is, by the nature of the ping and traceroute techniques used, the data is inherently unreliable and in need of great correction. RouteTree theory corrects it and makes it ready for actual human consumption... though not as food. Visualization: The final result of this program shows up in the right side of the window as a pretty graph of how you connect to the Internet. The graph is created with a highly resilient technique called Spring Embedding or force directied placement... basically, in both of these techniques, the graph is turned into a physical model of, say, atoms, which have repulsive and attractive forces that push and pull on each other. In the graph, dots that are connected attract each other, while unconnected dots repel each other. Over time, this leads to a very readable graph layout.This is how NetRadar works. There are a number of other things that can be done with the NetRadar framework, but it was implemented to demonstrate RouteTree theory, and so these other parts remain unimplemented.
NetRadar does not react well to firewalls. I've got some general advice and some speific advice for people with firewall setups:
General Advice: Allow UDP [32000-33000] out; allow ICMP in NetRadar sends out UDP probe packets on ports ranging from 33000 to 34000. Most of the time, the probe packets from NetRadar are allowed out of the network. More often, the reponses aren't received:
These packets generate error responses in the form of ICMP packets... often times firewalls percieve these packets to be "unsolicited" (because no corresponding ICMP out occurred) and kill them on the sopt. This is bad - NetRadar will simply report a blank screen and do nothing.
When it comes to debugging whether NetRadar is working with your firewall, go into the logfile that it generates on your windows drive and look for lines saying things like "Autotiming out " and an IP address. If this happens, then your firewall is killing either the UDP or the ICMp packets. Unfortunately, there is no way for my software to tell the difference between the different forms of packet death that a firewall will cause, so do your best to figure out your firewall configuration before emailing me. ZoneAlarm Users: Enable ICMP option in the pro version
This advice comes from other people, so I can't be very concrete. Here goes. ZoneAlarm apparently has this "Server Option" that makes some programs work... well it won't work for NetRadar. Don't try, it won't help you... NetRadar needs you to shut ZA off, or for you to enable ICMP message processing, which can only be done in the Professional Version according to some people. If you do that, however, you should be A-OK. Windows Internet-Connection-Sharing Users: Give up
I wish I could give better advice for people using Windows Internet connection sharing, but basically, the NAT engine that WICS uses is extremely wimpy, and can't handle the idea of ICMP packets at all, not to mention forwarding them. Get some good NAT software, such as WinRoute, if you have the money, as it works quite well with NetRadar and most other things. Or buy a linksys router, those will work fine too. NAT Users and Misc
I have used NetRadar behind a WinRoute network, and had no trouble. I have also used it behind several different Linksys purple boxes, which I assume are just hardware NAT solutions. Most all of these systems have options for forwading ICMP traffic, which you need to enable. If you do that, you'll be fine.
NetRadar: Your Internet Spyglass.